The Battle of Gettysburg, one of the most significant battles of the Civil War, provides a wealth of historical information that can be transformed into engaging math lessons for students. By analyzing the numbers and statistics surrounding the battle, educators can incorporate history into math and vice versa, making learning more interdisciplinary and dynamic. Here’s how to use facts and figures from the Battle of Gettysburg to enrich both math and history lessons.
Fact 1: The Number of Cannons
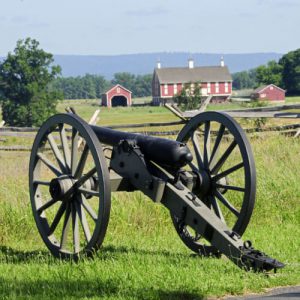
- Total Cannons at the Battle: Approximately 653 cannons were used—372 by the Union Army and 281 by the Confederate Army. Today, around 370 cannons remain on the battlefield.
Classroom Activity:
- Proportions and Ratios: Ask students to calculate the proportion of cannons used by each side. What percentage of the total cannons belonged to the Union? The Confederates?
- Union Cannons: (372 / 653) × 100 ≈ 57%
- Confederate Cannons: (281 / 653) × 100 ≈ 43%
- Subtraction: Have students calculate how many fewer cannons are present today compared to those used during the battle.
- 653 – 370 = 283 cannons no longer present on the battlefield.
Fact 2: Ammunition Fired
- Total Ammunition: An estimated 570 tons of ammunition was fired during the battle, often resulting in wasted shots due to poor aiming and battlefield conditions.
Classroom Activity:
- Weight Conversions: Ask students to convert 570 tons into pounds (1 ton = 2,000 pounds).
- 570 tons × 2,000 pounds = 1,140,000 pounds of ammunition.
- Comparisons: Compare the weight of ammunition fired to everyday objects. For instance, a typical car weighs about 4,000 pounds. How many cars would equal the total weight of ammunition fired?
- 1,140,000 ÷ 4,000 = 285 cars.
Fact 3: Horses and Mules
- Total Animals: Approximately 67,000 horses and mules were involved, with more than 3,000 (potentially up to 4,000) killed during the battle.
Classroom Activity:
- Percentages: Ask students to calculate the percentage of horses and mules killed in relation to the total number of animals present.
- If 4,000 animals were killed: (4,000 / 67,000) × 100 ≈ 5.97%.
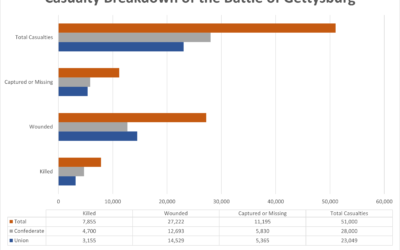
- Graphing: Have students create a bar graph comparing the number of animals present and those killed. They can also compare this to other battle-related statistics, such as soldiers killed or wounded.
Fact 4: Soldiers’ Age, Height, and Weight
- Average Soldier: Soldiers were typically between 19-25 years old, 5’8” tall, and weighed 143 pounds.
Classroom Activity:
- Averages: Students can calculate the average age or height of their class and compare it to the statistics from Gettysburg. How do their class averages compare to those of Civil War soldiers?
- Mean, Median, Mode: Provide a list of different ages, heights, or weights for soldiers, and have students calculate the mean, median, and mode for the data.
Fact 5: Marching Distance
- Marching Rate: Soldiers marched about 2.5 miles per hour and covered roughly 20 miles per day. A corps on the march stretched up to 10 miles long.
Classroom Activity:
- Distance and Time Calculations: If soldiers march 2.5 miles per hour, how long would it take them to cover 10 miles?
- 10 miles ÷ 2.5 miles per hour = 4 hours.
- Word Problems: Create math problems based on marching rates. For example, if a soldier starts marching at 8:00 AM and needs to march 20 miles in a day, what time would they finish?
- 20 miles ÷ 2.5 miles per hour = 8 hours of marching.
Fact 6: Pennsylvania and Virginia Soldiers
- Soldiers by State: Pennsylvania had the most Union soldiers (23,400), followed by New York (23,100). Virginia had the most Confederate soldiers (19,100), followed by North Carolina (14,000).
Classroom Activity:
- Bar Graphs: Students can create bar graphs to compare the number of soldiers from different states. Which states contributed the most and least to the Union and Confederate armies?
- Adding and Subtracting: Ask students to calculate the difference in the number of soldiers contributed by each state.
- Pennsylvania vs. New York: 23,400 – 23,100 = 300 more soldiers from Pennsylvania.
Fact 7: Loaded Rifles
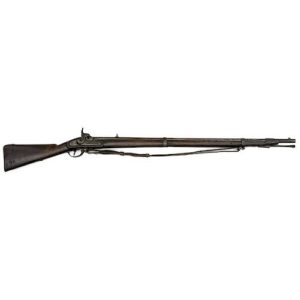
- Loaded Rifles: Of the 37,574 rifles recovered after the battle, approximately 24,000 were still loaded, including one rifle with 18 rounds still in the barrel.
Classroom Activity:
- Fractions and Percentages: What fraction of the rifles were still loaded? Convert that fraction into a percentage.
- (24,000 / 37,574) ≈ 0.64 or 64% of the rifles were still loaded.
- Multiplying: If one rifle had 18 rounds, how many total rounds would there have been if 100 rifles were loaded the same way?
- 18 rounds × 100 rifles = 1,800 rounds.
Conclusion: Bringing History and Math Together
The Battle of Gettysburg provides rich opportunities for students to explore math and statistics within a historical context. By analyzing the numbers—whether it’s calculating percentages of soldiers, converting tons of ammunition into pounds, or graphing data about cannons—students gain both historical knowledge and essential math skills. Cross-curricular lessons like these make history come alive in a new way, demonstrating the profound human impact of these events while reinforcing key mathematical concepts.
Data Credit: Gettysburg National Military Park


0 Comments